Screenshot of the National Data Office website.
Concerns of "statistical massaging" have re-emerged following the release of the "2025 Social Indicators of Korea" by the National Data Office on the 31st.
In its press release distributed on the same day, the National Data Office stated that among the social conflicts felt by Koreans last year, the "conservative-progressive" conflict was the highest at 80.7%. It also presented that in the subjective well-being category, the proportion of respondents who expressed satisfaction with their lives was 80.8%.
The issue is that the 80.8% life satisfaction figure is not a direct representation of the raw data. According to the notes in the press release, this figure represents the proportion of respondents who gave a score of 6 or higher on a 0-10 scale, i.e., an 11-point scale.
Considering that the same raw data for life satisfaction was presented as a score-based indicator of 6.4 just three weeks prior, the core of this controversy is not the number itself.
It lies in who, why, and by what criteria the same data was reprocessed to produce entirely different indicators.
This is why the 80.8% life satisfaction figure is particularly controversial.
This figure does not represent only those who answered 'very satisfied'. A score of 6 can be interpreted as 'so-so' or 'acceptable' in terms of general perception, rather than 'very satisfied', and can encompass a broader range.
Presenting all responses from 6 points and above as a single satisfaction rate without showing the original score distribution or average can lead to numbers with entirely different meanings, even from the same raw data.
Hanmi Ilbo compared media reports based on press releases distributed by the National Data Office on March 5th and March 31st.
Both sets of data related to 'quality of life' are based on the same raw data. However, a glance at the article headlines reveals how much the results have changed.
Looking at the headlines of articles written based on the March 5th press release, which provided score-based data:
△ Koreans' life satisfaction at 6.4 points, 'stagnant'... 33rd out of 38 OECD countries (News1)
△ Koreans' life satisfaction, again among the lowest in OECD... Suicide rate also rising (YTN)
△ Stocks are rising and housing prices are falling... Koreans' life satisfaction still at the bottom of the OECD (Maeil Business Newspaper)
Overall, the nuance is strongly negative.
In contrast, articles based on the March 31st press release, which presented life satisfaction at 80.8%, include:
△ Last year, life satisfaction increased & sense of isolation decreased... Low birth rate and income inequality remain (Aju Business Daily)
△ 8 out of 10 citizens are satisfied with their lives... "Influence of increased consumption and travel" (KBS)
△ Overseas travel experience rate doubled in 2 years... 'Life satisfaction' also improved (Etoday)
Overall, the nuance is strongly positive.
The statistics were the same, but by changing the way the same statistics were segmented and presented, the impression of society that the public received was completely reversed.
Why did this happen?
Hanmi Ilbo's investigation revealed that the Korea Institute of Public Administration, which conducted the survey, stated, "The original survey was conducted on a 0-10 scale in accordance with OECD happiness index standards." They added, "Grouping responses of 6 or higher to create a satisfaction category was at the request of the National Data Office."
On the other hand, in its initial phone call with Hanmi Ilbo, the National Data Office explained, "We reflected the data sent by the Korea Institute of Public Administration as is." This implies one side claims it was at the request of the National Data Office, while the other claims they merely reflected the data sent by the research institute.
However, in a second phone call, the National Data Office explained, "After checking, it is true that we requested it." They also expressed a desire not to harm the Korea Institute of Public Administration. The National Data Office further explained that this method has been ongoing since 2019, and evidence suggests the same standard has been continuously applied since 2020.
Statistically speaking, this is a case of reconstructing score-based data into a ratio indicator by cutting it at a certain threshold. An average score of 6.4 and a satisfaction rate of 80.8% for responses of 6 or higher are different statistical expressions, even when derived from the same raw data.
Therefore, such conversions of indicators must be accompanied by pre-determined criteria, consistent application principles, and thorough explanations. Otherwise, even the same data can create entirely different societal narratives.
It is common sense that changing the interpretation of statistics or assigning different meanings should be followed by deliberation from statistical experts and administrative decision-making processes.
However, when Hanmi Ilbo inquired about this, the National Data Office stated, "There are no official processing guidelines to support this."
The National Data Office cited "Research Service Report for the Integration and Utilization Enhancement of Indicator Systems in 2019, page 357" as justification. The author of the report was the Korea Society for Quality of Life (President Han Jun). However, this is merely a commissioned output and cannot be considered a finalized internal guideline.
Ultimately, the question remains clearer: Without official guidelines, who made the decision to set the processing criteria for the same data, and why was that method continuously applied?
What is needed now is not a comprehensive explanation. It is to clarify who first proposed treating responses of 6 or higher as 'satisfied,' through what review process that criterion was adopted, and who is ultimately responsible for that decision.
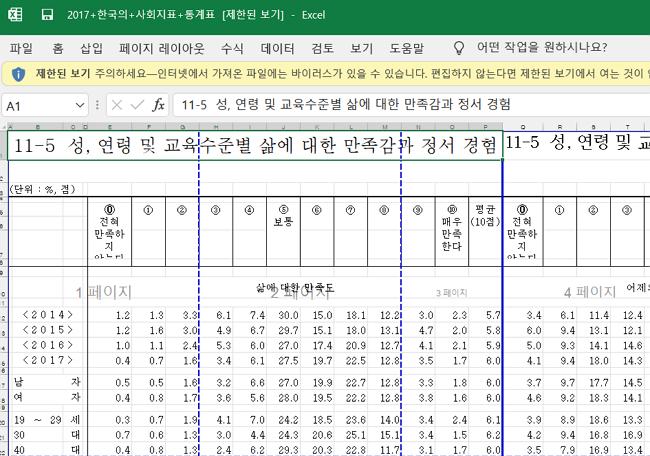 Photo 1 Statistical data related to life satisfaction from the '2017 Social Indicators of Korea' press release. Presented in distribution by score range and average. [Photo = Hanmi Ilbo]The problem does not end here. This processing method has not only been applied to the current press release but also to recompiled data from the past as if the same criteria had existed from the beginning.
Looking at the 2017 National Statistical Office's 'Social Indicators of Korea' press release obtained by Hanmi Ilbo, life satisfaction is presented in the form of response distribution and average for each score range. (See Photo 1)
While the 2017 data was 'distribution and average', in the 2025 data, even the 2017 data has been changed to 'time series of satisfaction rates'. This creates the illusion that a time series of satisfaction rates has been applied from the outset. The data itself has not changed, but the administrative method of presenting the data has.
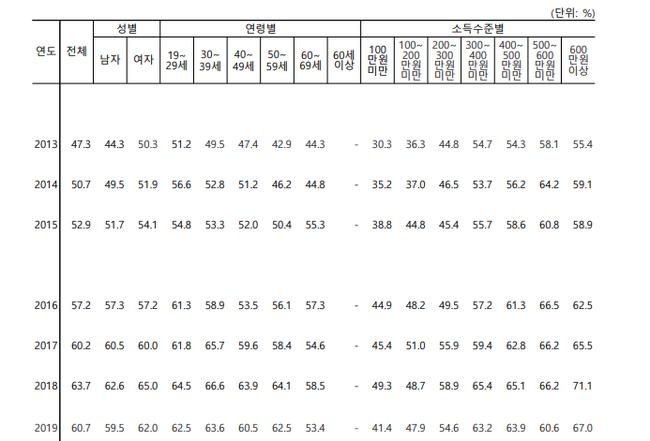 Statistical data related to life satisfaction from the '2025 Social Indicators of Korea' press release. The 2017 statistics have also been rewritten as a time series of satisfaction rates. [Photo = Hanmi Ilbo]
Government press releases are official documents made public to citizens. If past data is altered, a proper explanation must follow.
The National Data Office explains that this data is an annual comprehensive indicator created by reclassifying and processing statistics published by various agencies. However, precisely because of this, the criteria for change must be more stringent and transparent.
If 'life satisfaction,' based on the same data, was presented as 6.4 points three weeks ago and 80.8% on the 31st, the public has one question to ask.
It is, "Who and why did they cut the same data into indicators with entirely different meanings?"
Statistics exist to explain society. However, if those statistics are reconstructed into numbers with different meanings for administrative convenience or intention, instead of explaining society, it is not just a single press release that wavers, but the reliability of national statistics as a whole.
Given past precedents of damaged trust due to distortion controversies surrounding national statistics, this suspicion also leads not to a simple issue of interpreting numbers, but to the fundamental question of 'Can national statistics be trusted?'
The essence of this controversy is not whether the figure of 80.8% life satisfaction is high or low. It is to clarify the facts: why the same raw data changed from 6.4 points to 80.8%, who created the criteria, and why they were continuously applied without official guidelines.
The National Data Office can no longer get away with vague explanations.
Now, it must present responsibility, not just numbers.
If the same raw data went from 6.4 points to 80.8% in just three weeks, the problem lies not with the statistics, but with the person who cut the statistics.

 Trump pressures for rate cut again ahead of FOMC... "Should be the lowest in the world"
U.S. President Donald Trump. [Photo = The White House] U.S. President Donald Trump once again pressured the Federal Reserve, the U.S. central bank, to lower interest rates on the 27th (local time
Trump pressures for rate cut again ahead of FOMC... "Should be the lowest in the world"
U.S. President Donald Trump. [Photo = The White House] U.S. President Donald Trump once again pressured the Federal Reserve, the U.S. central bank, to lower interest rates on the 27th (local time
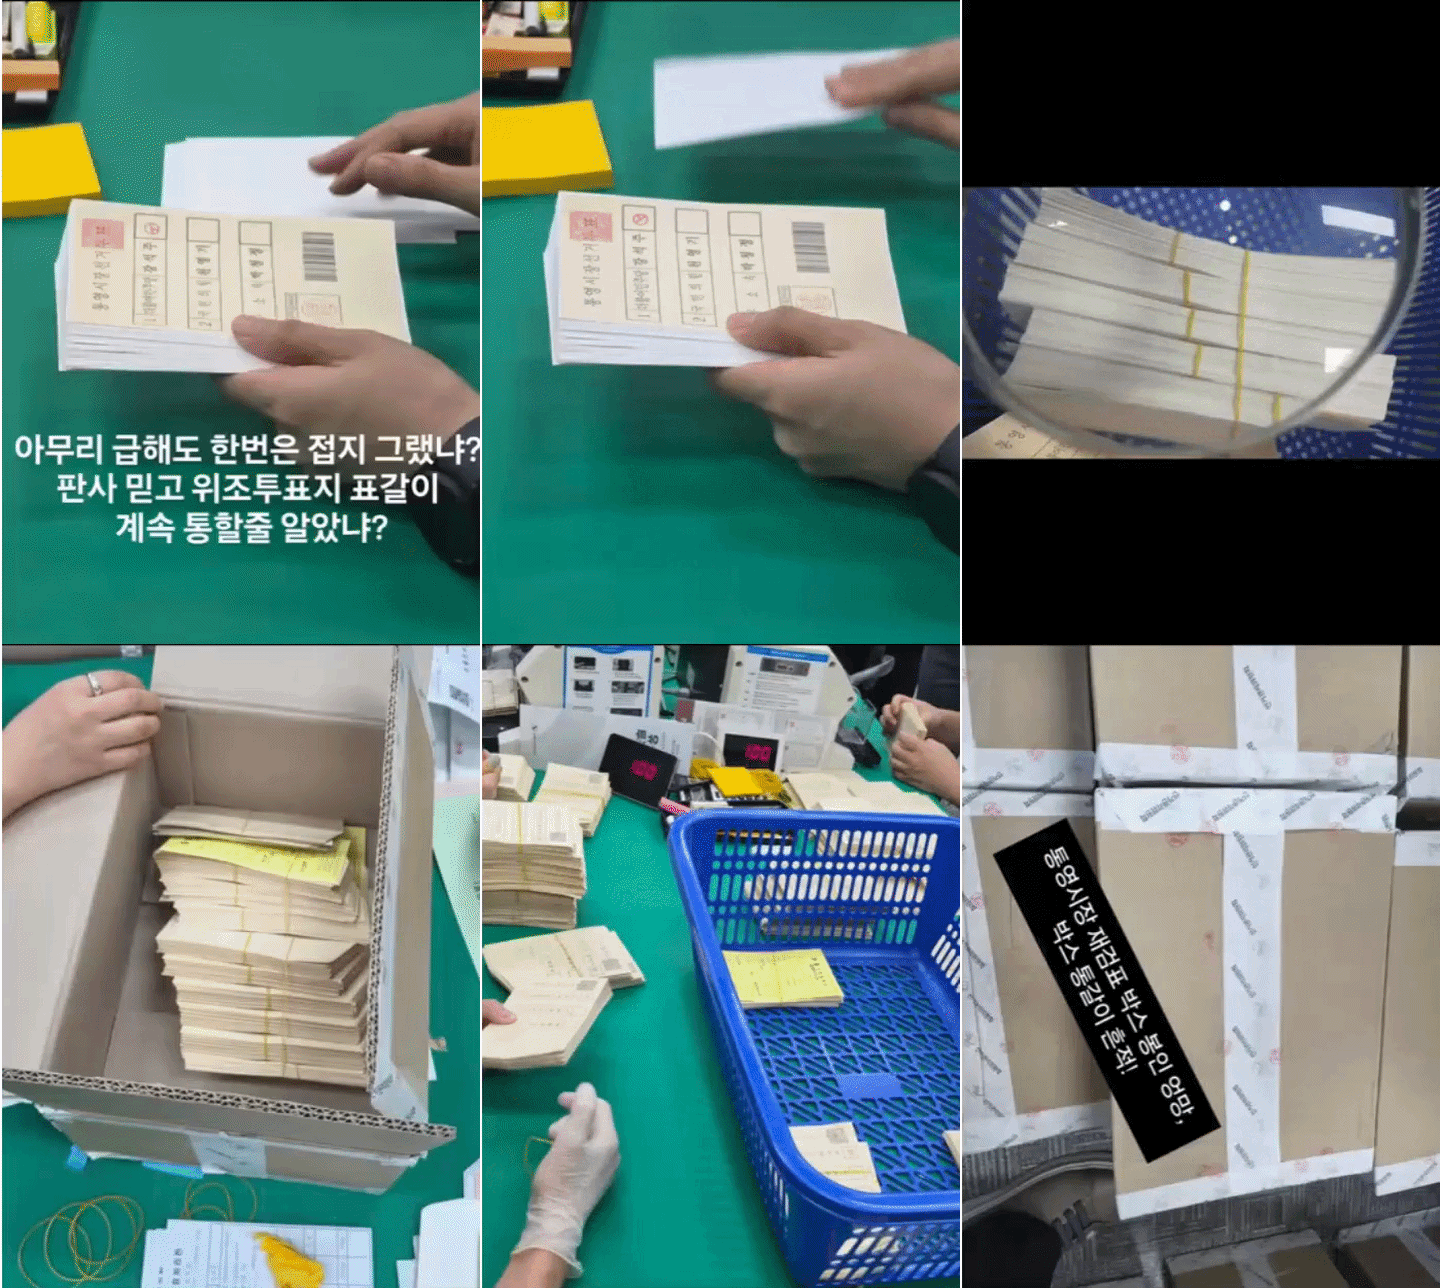 “Ignoring crisp ballots and damaged seals”… Tongyeong mayoral recount concludes with ‘no change in outcome,’ leaving suspicions and public outrage behind
Suspected counterfeit ballots discovered in Tongyeong [GIF from social media of Representative Hwang Kyo-ahn / Attorney Park Joo-hyun]During a recount of the Tongyeong mayoral election in South Gyeong
“Ignoring crisp ballots and damaged seals”… Tongyeong mayoral recount concludes with ‘no change in outcome,’ leaving suspicions and public outrage behind
Suspected counterfeit ballots discovered in Tongyeong [GIF from social media of Representative Hwang Kyo-ahn / Attorney Park Joo-hyun]During a recount of the Tongyeong mayoral election in South Gyeong
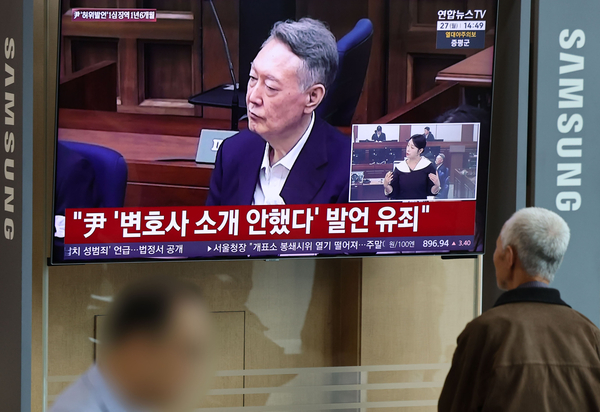 President Yoon, regarding the first-instance ruling on the Public Official Election Act: “An excessive political verdict that distorts the facts… We will appeal immediately.”
The first-instance sentencing hearing for President Yoon Suk Yeol regarding violations of the Public Official Election Act is being broadcast live at Seoul Station on the 27th. [Photo=Yonhap News]Pres
President Yoon, regarding the first-instance ruling on the Public Official Election Act: “An excessive political verdict that distorts the facts… We will appeal immediately.”
The first-instance sentencing hearing for President Yoon Suk Yeol regarding violations of the Public Official Election Act is being broadcast live at Seoul Station on the 27th. [Photo=Yonhap News]Pres
 WSJ: "SK Hynix ADR Premium Is a Sign of AI Trading Overheat"
Advertisement for SK Hynix ADR listing in New York's Times Square [Reuters=Yonhap News file photo]The Wall Street Journal (WSJ) has pointed out that the price of SK Hynix’s American Depositary Recei
WSJ: "SK Hynix ADR Premium Is a Sign of AI Trading Overheat"
Advertisement for SK Hynix ADR listing in New York's Times Square [Reuters=Yonhap News file photo]The Wall Street Journal (WSJ) has pointed out that the price of SK Hynix’s American Depositary Recei
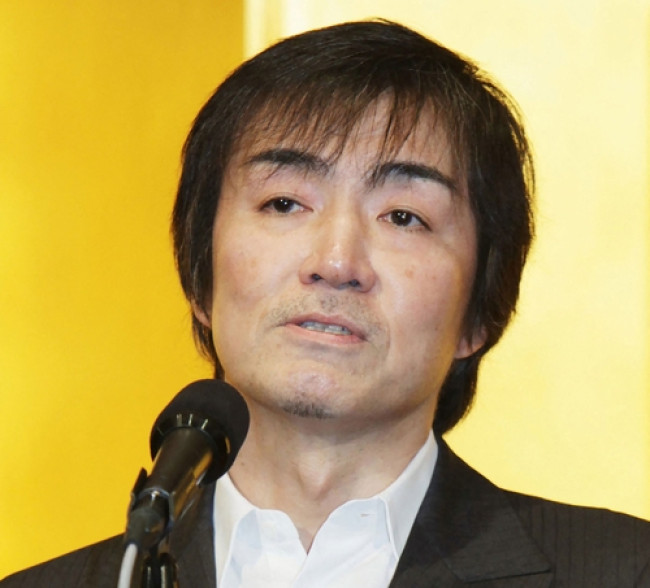 'Godfather of Japanese Mystery Novels' Keigo Higashino Passes Away After Battle with Cancer at 68
Famous Japanese mystery novelist Keigo Higashino [AFP=Yonhap News]It has been belatedly reported that Keigo Higashino, the "godfather of Japanese mystery novels" and author of bestsellers such as "The
'Godfather of Japanese Mystery Novels' Keigo Higashino Passes Away After Battle with Cancer at 68
Famous Japanese mystery novelist Keigo Higashino [AFP=Yonhap News]It has been belatedly reported that Keigo Higashino, the "godfather of Japanese mystery novels" and author of bestsellers such as "The
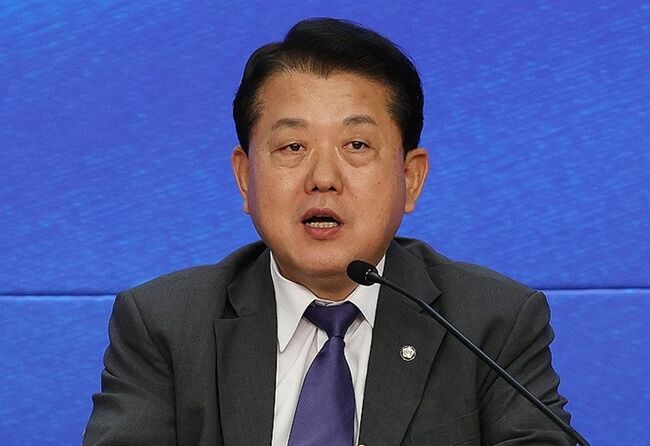 [Park Pil-kyu Security Column] To the Ignorant Trying to Clothe a Beast in Sheep's Clothing
Rep. Kim Byung-joo of the Democratic Party of Korea [Photo=Yonhap News]“The Air Force Academy doesn't teach you how to fly a plane!” “The Army, Navy, and Air Force academies are exactly the
[Park Pil-kyu Security Column] To the Ignorant Trying to Clothe a Beast in Sheep's Clothing
Rep. Kim Byung-joo of the Democratic Party of Korea [Photo=Yonhap News]“The Air Force Academy doesn't teach you how to fly a plane!” “The Army, Navy, and Air Force academies are exactly the
 [Issue Diagnosis] Two Effects of the Election Petition Review
 [Photo] Evidence of Election Fraud Flooding U.S. Media… Trump Had 2.7 Million Votes Stolen
 [Video] U.S. Semiquincentennial Air Show... 'Art in the Sky' streaks across New York
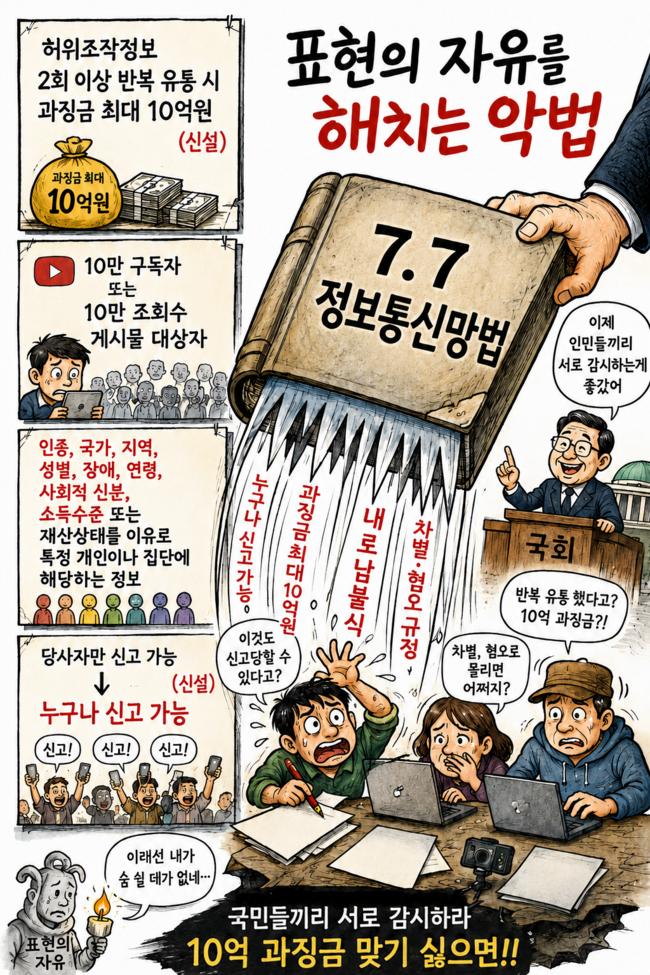 [Editorial Cartoon] A Draconian Law That Undermines Freedom of Expression

 List
List